
Alinea Customs Briefing – In this article, we examine the differences between UK and EU CBAM, looking beyond carbon prices to how each system calculates the cost of embedded emissions. We focus on free allocation and its implications for steel, alongside practical considerations for fertilisers and cement.
Common Objective, Different Structures
UK CBAM and EU CBAM address the same problem but create the obligation with different architectural structures. The common goal of both these systems is to reduce carbon leakage, and ensure that importers pay equivalent carbon emissions rates as domestic producers to establish a level playing field. Carbon leakage is when production moves to countries with lower carbon costs, potentially shifting greenhouse gas emissions abroad instead of reducing them. The goal of local carbon pricing instruments – the UK emissions trading system (ETS) is to ultimately achieve Net Zero commitments made under the Paris Agreement 2015, ratified by 194 countries, The United Nations Framework Convention on climate change, and The Montreal Protocol’s Technical and Economic Assessment Panel (TEAP) – which have established legal international obligations to reduce climate gases under the Kyoto Protocol.
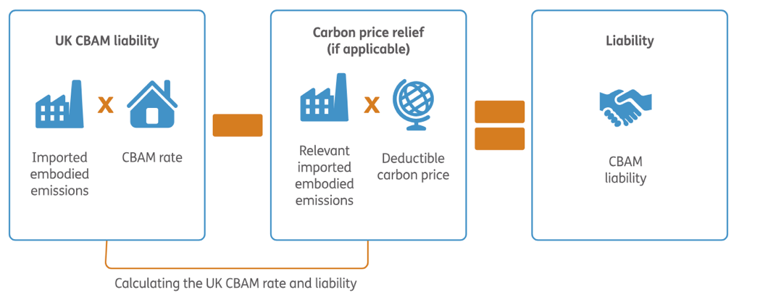
The implementation of CBAM establishes a carbon cost to the embedded emissions of the imported goods within the scope. The UK sets this up as a tax-based system. A sectoral CBAM rate is applied to the imported goods’ emissions that are in the scope. If a carbon cost paid in the country of origin (CPR) Carbon Price Relief that meets the criteria is deducted and the final tax liability is calculated. So, the resulting obligation for the importer is a tax liability to be declared and paid to HMRC.
The EU uses the certificate-based system for this. The relevant authorised CBAM declarant purchases and surrenders enough CBAM certificates to cover the liability. The certificate price is based on EU ETS allowance auction prices. The certificate price is based upon the weighted average of EU ETS (Emissions Trading System) allowance auction clearing prices over a specific reference period – set per quarter in 2026, and to be established on a weekly basis in 2027. The date of entry into free circulation will determine the tax point and therefore the certificate price.
However, the cost variance cannot be explained solely by the distinction between a tax-based and a certificate-based system. Both can theoretically create similar amounts of cost. The real topic which we will inspect in our next paragraph is how and which steps of the calculation is free allocation adjustment implemented.
How Free Allocation Shapes the Calculation
Free allocation is considered in both systems. In the UK, it affects the carbon price that will be applied and, in the EU, it affects the certificate number to be surrendered. We need to clarify the free allocation first. Domestic producers covered by an ETS may receive a certain amount of emission allowances free of charge. This ensures that they don’t have to purchase allowances for all emissions resulting from their production. The CBAM calculation takes this support into consideration.
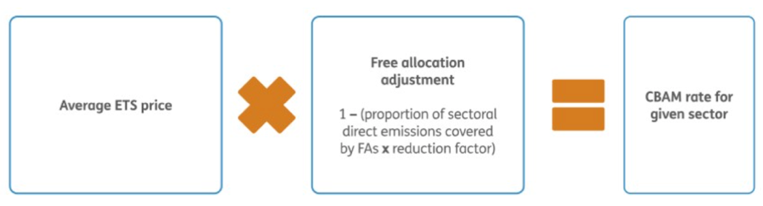
In the UK, this support is reflected when calculating the sectoral CBAM rate. The UK ETS price is adjusted using the sector’s historical free allocation coverage proportion multiplied by the reduction factor for the relevant year. This way, the rate that importers would apply to goods’ emissions is already adjusted for free allocation. You do not apply the free allocation discount after using the CBAM rate.
In the EU, free allocation adjustment reduces the number of CBAM certificates that need to be surrendered. While calculating this adjustment; the quantity of imported goods, relevant CBAM benchmark, annual CBAM factor and applicable cross-sectoral correction factor are considered. So, we do not have a single sectoral percentage to be applied to all imported emissions.
The benchmark used in the EU system is a reference value to help with free allocation adjustment. It is an entirely separate factor to the actual emission intensity, which shows the real emission intensity of the goods. EU regulation transforms relevant ETS benchmarks to CBAM benchmarks appropriate to the goods concerned.
To see the difference, let’s use some purely illustrative figures and ignore overseas carbon price relief: First, we shouldn’t confuse the weight of imported steel and the emissions regarding the production of that steel. In the UK, government determines the price to be applied for a tonne of emission, which is the sectoral CBAM rate. While calculating this amount, government considers the free allocation rate, so this support is already reflected in the rate.
Case study:
| Product | HGCS Pressurised Stainless Steel Vessels/Tanks |
| Commodity code | 7311009900 |
| Origin | CN |
| Quantity (t) | 2500 |
| Import | Q1 2027 |
Hypothetical scenario: UK ETS price is £58.88/tCO₂e .
How are the free allocations calculated?
Alinea have estimated that the proportion of sectoral direct emissions covered by FAs as follows.
The best public data is Table 4 of DESNZ’s analytical annex on free allocation for CBAM sectors. It groups UK ETS registry data for iron and steel installations (SIC 24.10 and 24.20). It covers 20 installations, with emissions of 11,870,000, 10,110,000 and 9,380,000 tonnes in 2021, 2022 and 2023, and free allocation of 10,320,000, 10,280,000 and 8,640,000 over the same years.
Using the ratio of average free allocation to average emissions, which is how HMRC describes the method:
| Years used | Average free allocation | Average emissions | Proportion |
| 2022 and 2023 (the statutory years available) | 9.46m | 9.745m | 97.1% |
| 2021 to 2023 | 9.747m | 10.453m | 93.2% |
| 2023 only | 8.64m | 9.38m | 92.1% |
The 2022 and 2023 figure matches the statutory baseline most closely, but it is missing 2019. The 2021 to 2023 figure gives a steadier three-year average. A central figure of 95% sits between them. It also matches a published market estimate: CarbonChain estimates the steel proportion could be around 95%.
The 2027 0.975 reduction factor is identified in Article 19 (9) of The Greenhouse Gas Emissions Trade Scheme (Amendment) Order 2026.
When we use the figures 95% for steel proportion free allocation and 97.5% for reduction factor, we can find the free allocation adjustment as 0.07375. For the sectoral CBAM rate calculation, we still need the average ETS price. We are using purely illustrative figures for the calculations, so we can assume the average ETS price as £58.88. For the CBAM rate, we need to multiply the average ETS price and free allocation adjustment, which gives us £4.3424/tCO₂e. Assume that one tonne of imported HGCS Pressurised Stainless Steel Vessels/Tanks has embedded emissions of 6.645 tCO₂e, so the embedded emissions for 2500 tonnes are 16,612.5.
The UK CBAM liability, ignoring the carbon price relief, for HGCS Pressurised Stainless Steel Vessels/Tanks is as follows:
16,612.5 multiplied by £4.3424 is equal to: £72,138.12.
In the EU CBAM, free allocation is not applied by reducing the certificate price. The number of certificates to be surrendered is reduced instead of the price. The reduction depends on the relevant CBAM benchmark and applicable factors. Let’s calculate the same good which carries 6.645 tCO₂e. The free allocation adjustment will be calculated using the default values published by EU. The default CBAM benchmark for the route C is 1.364.
The CBAM factor for 2027 is 0.95. So, the free allocation per tonne is 1.2958 tCO₂e. To find the emission left per tonne, the free allocation per tonne is subtracted from the default emissions value. So, the calculation is 6.645 minus 1.2958 is equal to 5.3492. The certificate number needed is calculated by multiplying this number with the tonnes of the good, which in this case 2500 tonnes. So, 5.3492 multipled by 2500 is equal to 13,373. The EU CBAM liability is calculated with this number multiplied by the certificate price, which is a hypothetical number for 2027 Q1. We will use an illustrative figure of €85.35.
Therefore, the calculation of EU CBAM liability is €1,141,385.55. When we look at the figures now, the initial certificate number needed to be surrendered was 6.645×2500=16,612.5. After the adjustment, the certificate number is 13,373. However, the price does not change for the EU CBAM, the only thing that changes is the number of certificates to be surrendered.
The most important point to take away from these calculations is when the UK’s rate adjustment reduces the price applied for every tonne of emission, EU’s benchmark-based adjustment reduces the amount of certificate obligation. So, the difference is not only the order of multiplication and subtraction, but also what determines the discount.
Sector Specific Inspection: Why Production Routes Matter
The analysis becomes more complex when sector-specific factors are considered. We will talk about steel sector as an example as steel is not produced in a single production route, the difference between sector-wide rate and production-route-specific benchmark gains a lot of significance.
Let’s learn about the three steel production routes:
Blast Furnace / Basic Oxygen Furnace (BF-BOF): The production route starting from iron ore, using a blast furnace and then a basic oxygen furnace.
Scrap-Based Electric Arc Furnace: The production route that melts scrap in an electric arc furnace to make steel.
Direct Reduced Iron / Electric Arc Furnace (DRI-EAF): The production route that produces the steel in an electric arc furnace using the direct reduced iron.
EU’s CBAM benchmark regulations distinguish between different steel production routes. So, “steel benchmark” does not mean a single number for all the steels.
In the UK, a single CBAM rate is applied to every iron and steel good within the scope in the same quarter. The free allocation adjustment of this rate depends on the historical data of the UK sector. UK sectoral rate does not depend on the production route. However, it does not mean that the UK completely ignores the production route, it can affect the embedded emissions of the product. So, although the same rate is applied, two different steel shipment can result in different CBAM liabilities as the emissions are different.
The values that are used to calculate liabilities can be default and actual values. Actual values are calculated using installation-specific data in accordance with the applicable methodology and must be verified by an appropriately accredited independent verifier. Inc circumstances where a supplier does not have verified actual emissions data the default values, published by the UK government, must be used.
Under EU CBAM, the production route, additional to the emissions side, is of critical importance to the free allocation adjustment. Especially if default values are used, regulation needs the production route and relevant default emission value’s route to match. So, a route’s emissions value cannot be mixed with another route’s more beneficial benchmark.
Therefore, it is not enough to look at the ETS price and quantity of imported goods while comparing the costs of UK and EU CBAM. The embedded emissions of the goods and, for EU calculations, benchmark and production route must be taken into consideration. However, this comparison must not be limited to today’s conditions. As free allocation is gradually phased out, the adjustments applied under both systems will change, as discussed in the next section.
Phasing Out Free Allocation: Will Costs Converge?
As free allocation is gradually phased out, the reduction in the carbon cost of imports becomes smaller in both systems. The thing that is phasing out is not the physical emissions of the good, but the free allowance support given to domestic producers. Since CBAM calculations reflect this support, when the support gets reduced, the free allocation adjustment in the CBAM also gets reduced. In the UK, this change is reflected in the sectoral CBAM rate, calculated as follows:
UK CBAM rate = P x (1 – B x F)
In this formula, B means historical free allocation coverage, F means annual reduction factor. As the phase-out continues, F gets smaller. The deduction from the ETS price therefore becomes smaller and while the other factors are constant, CBAM rate increases. When F hits zero, the free allocation discount in this formula disappears.
In the EU, this change is reflected in the certificate requirement. As the relevant annual CBAM factor decreases, the free allocation adjustment decreases for the same quantity of goods and the same benchmark, assuming other applicable factors remain unchanged. The CBAM factor that gets decreased does not mean lower costs, the one that reduces is the adjustment that reflects free allocation.
To understand this, let’s create another scenario with illustrative figures, and to ignore the exchange rate, assume the ETS price as 60 currency units per tCO₂e and assume emissions as 3 tCO₂e for both systems. When there’s free allocation support, as the adjusted rate of UK is 6, 3×6=18 for UK and adjustment of certificate for EU is 1, so (3-1)x60=120. However, when we look at the time where free allocation adjustment is zero for both, for UK, 3×60=180 and 3×60=180 for EU.
The costs are equal in this illustrative scenario because both systems are assumed to apply the same carbon price to the same quantity of covered emissions, with no carbon price relief. Once both free allocation adjustments reach zero, the cost difference attributable to those adjustments disappears. However, this does not imply that actual UK and EU CBAM costs will necessarily converge, as carbon prices, emissions methodologies and available carbon price relief may continue to differ.
UK-ETS Linkage: Potential Implication for CBAM
The two parties’ aim of linking ETS systems to each other must be considered while assessing the differences between UK and EU CBAM. In The House of Commons Business and Trade Committee’s June 2026 report, the goal is described as creating a common carbon market and allowing mutual CBAM exemptions. According to an article published by the Chartered Institute of Export & International Trade on 8 October 2026, citing Politico, the two parties have reached agreement on how to link the ETS systems. However, this agreement consists of a package with youth mobility and SPS agreements. According to the news, unless the other agreements become certain, ETS agreement will not proceed.
If this linkage and CBAM exemptions are implemented, the CBAM payments and reporting liabilities can reduce for the UK-EU trades that meets the requirements. However, the goods that are in scope, date and conditions for the exemption will depend on the final adjustments. Therefore, we cannot assume a product imported from China will automatically be exempt.
The calculations in this article compare the UK and EU CBAM systems through their different structures and stated assumptions. The linkage of ETS systems and application of mutual CBAM exemptions may change the costs arising from the UK-EU trade that meets the requirements. However, the example calculations don’t involve the effects of a future linkage agreement.
Fertilisers and Cement: Composition, Units and Emissions Scope
For fertilisers, composition and functional unit of the product are very significant in CBAM calculations. UK System Boundaries Document identifies the functional unit for fertilisers as the kilograms of nitrogen (kg N) contained in the product. For example, 1 tonne of pure nitric acid (HNO₃) contains approximately 222.2 kg nitrogen. When calculating precursor emissions using a quantity expressed in kg N, the corresponding emissions intensity must be shown as tCO₂e/kg N. Emissions intensity given per tonne HNO₃, cannot be multiplied with kg N amount without the necessary conversion. If the nitric acid is used as a solution, concentration must be taken into consideration as well.
A similar approach is applied through tonnes of clinker in the specified cement goods. For example, if 60% of 1000 tonnes of cement is clinker, the emissions contribution of the clinker precursor is calculated using 600 tonnes. However, this contribution must be considered with other precursor and production emissions. These approaches are not limited to the UK. EU CBAM methodology also considers nitrogen content in relevant fertiliser goods and clinker content in stated cement goods. Under EU CBAM, the applicable functional unit must be checked against the relevant CN code; kilograms of nitrogen (kg N) are specified for goods under CN codes 2808 00 00, 2814 and 3105.
These examples show that a correct CBAM comparison depends not only on the carbon price and free allocation adjustment, but also on the correct product composition and consistent units for quantities and emissions intensities. However, this common approach does not mean that two systems use the same emissions scope. EU CBAM includes direct and indirect emissions in the scope for fertilisers and UK CBAM, in the beginning, excludes indirect emissions from the scope. The inclusion of indirect emissions in UK CBAM has been deferred until 2029 at the earliest.
Conclusion
UK and EU CBAM share the same goal, but their calculation structure are based on fundamentally different methodologies. The EU ETS covers over 15,000 installations, whereas the UK ETS regulates around 1,000. Pricing related to CBAM is heavily influenced by supply and demand dynamics, particularly those established in utilities – e.g. when the price of gas rises, as a result, more coal is burned, and therefore more carbon purchases may occur. As the free allocation phases-out in time, one of pivotal reasons for the two systems to be different will diminish and eventually disappear. For a healthy comparison, we should not only be considering carbon pricing, but also the relevant benchmarks, product’s composition and emission scope.
How can Alinea Customs help?
Alinea Customs can help assess whether your goods fall within scope, support the collection of relevant emissions data and verification documents from suppliers, and identify information gaps. We can also assist with financial and contractual planning and develop a tailored preparation roadmap for your business.
Through UK CBAM Fundamentals training, we can help strengthen your team’s knowledge and understanding of the steps needed to prepare your business.
Please contact customs@alineacustoms.com for further information.